Trading Signals
A real-time trading-signal tracker — buy/sell calls with entries, take-profits, and stop-loss, updating live as each signal plays out.
Overview
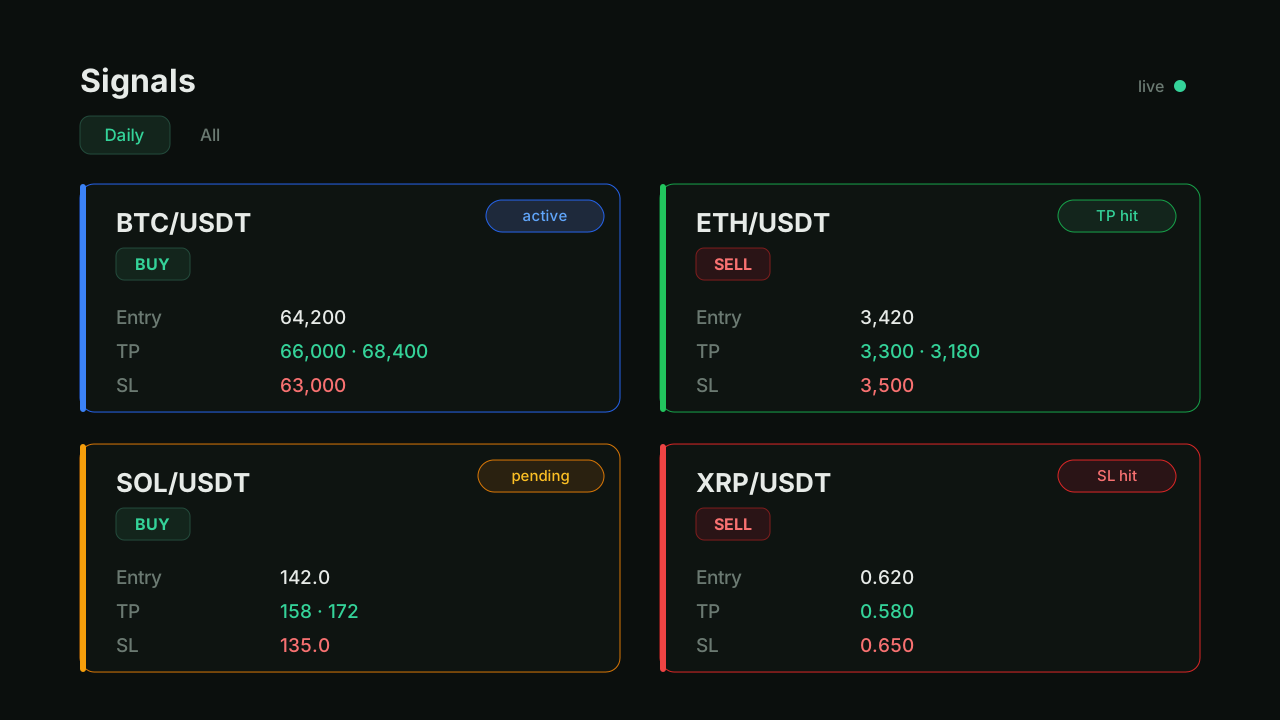
Trading Signals is a real-time tracker for trade calls. Each signal is a clear, structured plan — a symbol, a buy or sell direction, entry prices, take-profit targets, and a stop-loss — and the board updates live as every signal moves through its lifecycle.
The Problem
Trade ideas usually arrive as messy text in a chat: a symbol, some numbers, an arrow. Following them means squinting at scrollback and tracking in your head whether a target hit or a stop got taken out. I wanted those calls turned into structured, living records you can actually read at a glance.
A Signal, Structured
Every signal captures the full plan in one place: the pair, direction, one or more entry prices, a ladder of take-profit targets, and a stop-loss — plus free-form notes for context. Because the data is structured rather than prose, the board can reason about it: color-coding, filtering, and a daily view all come for free.
Live Status
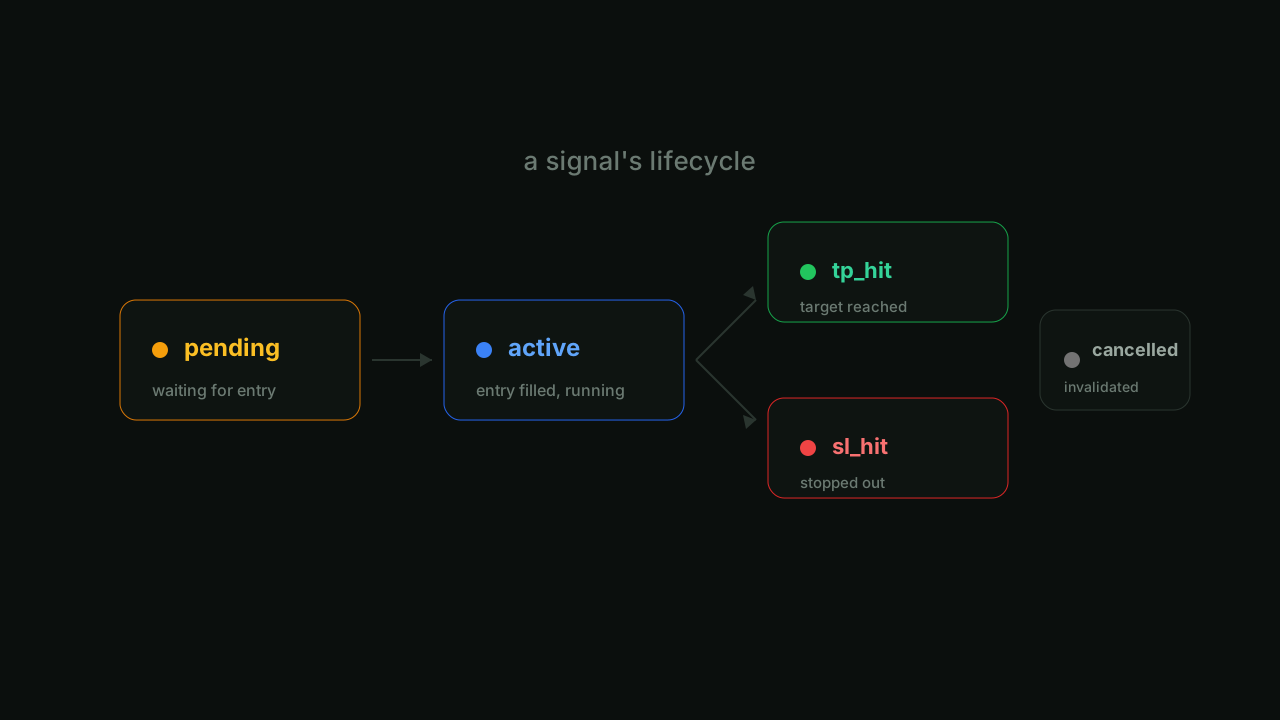
Signals move through a clear lifecycle — pending, active, tp_hit, sl_hit, or cancelled — and the board reflects changes in real time. Update a status in one place and it propagates instantly, so anyone watching sees the same truth without refreshing.
Charts in Context
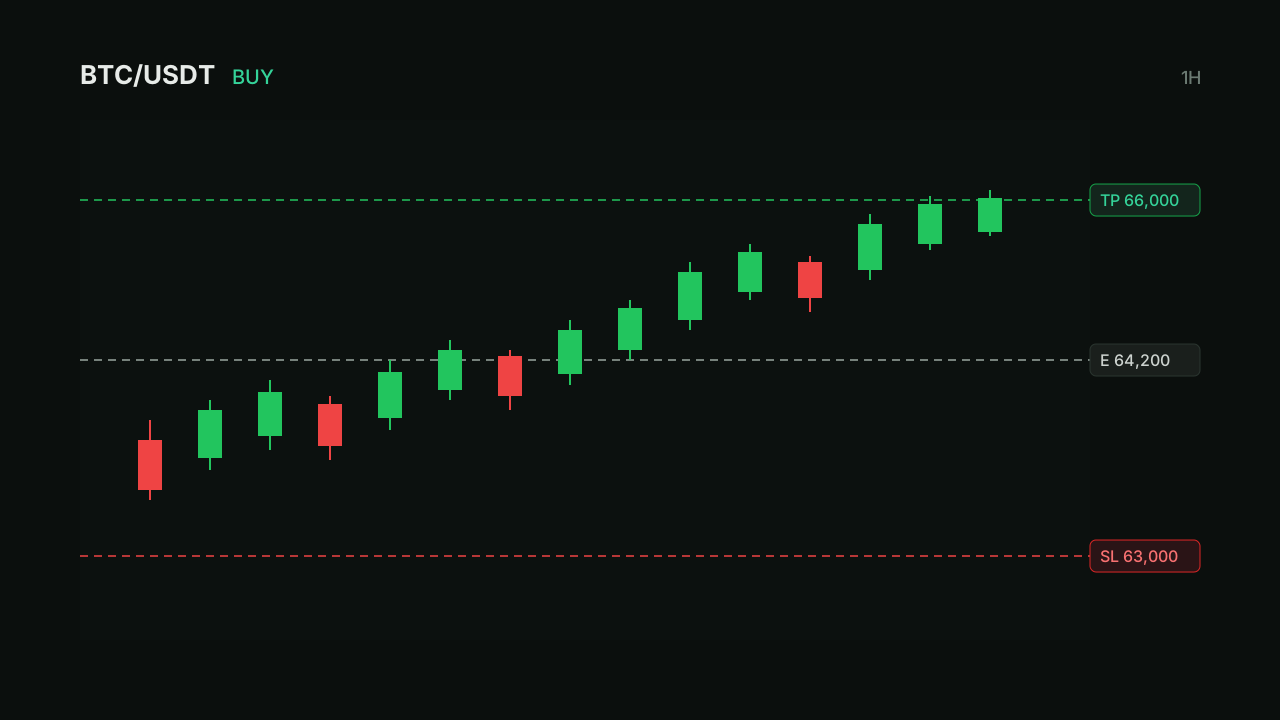
Each signal pairs with a candlestick chart, with the entry, take-profit, and stop-loss drawn right on it — so the plan and the price action sit in the same view instead of two tabs.
The Stack
Built with Next.js and TypeScript, with Supabase for storage and real-time updates and Lightweight Charts for the price view. The focus was a fast, legible board that tells you the state of every call the moment it changes.